User Guide
Enter your follower count
Use the current figure from the account you are measuring. This is the denominator, so an out-of-date number skews everything.
Enter likes and comments
Take them from a single post, or add up several posts and enter the totals. Averaging across your last 9 to 12 posts gives a far more stable figure than any one post.
Add saves and shares if you have them
The optional extra field covers saves, shares and any other interaction you want counted. Include them consistently — a rate that sometimes counts saves and sometimes does not cannot be compared with itself.
Read the rate and the band
The result is a percentage with a band showing how it compares to typical ranges. Anything above 3% is generally healthy on most platforms.
Measure the same way every time
Different tools and agencies define this differently. Whichever definition you pick, keep it constant, and state it when you quote the number to a brand.
Track it over time
A single reading means little. A rate falling steadily while followers rise usually means the audience is growing less relevant, which is worth catching early.
About the Engagement Rate Calculator
Engagement rate measures how actively an audience responds, rather than how large it is. It is the first number most brands ask for, because follower count alone says nothing about whether anyone is paying attention.
The formula
engagement rate = (likes + comments + other interactions) ÷ followers × 100
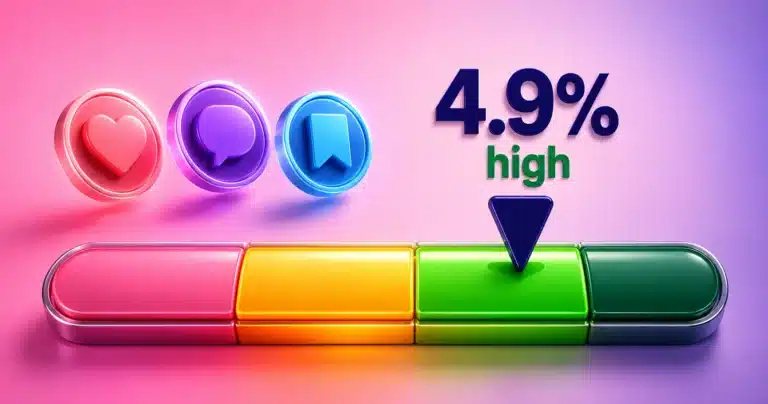
With the defaults — 10,000 followers, 450 likes, 35 comments — that is (450 + 35) ÷ 10,000 × 100 = 4.85%. Comfortably healthy on most platforms.
There is no single correct definition
This is worth knowing before you compare your figure to anyone else’s. Engagement rate is not a standardised metric, and the common variants produce noticeably different numbers from identical activity:
| Variant | Divided by | Notes |
|---|---|---|
| By followers | Follower count | Most common; what this tool uses |
| By reach | Accounts reached | Higher figure; needs analytics access |
| By impressions | Total impressions | Lowest figure of the three |
Whether saves and shares are counted moves the result again. None of these is wrong — but a rate calculated by reach cannot be compared with one calculated by followers, and agencies quoting impressive numbers are sometimes simply using a more generous denominator. Say which one you used.
Interpreting the number
| Rate | Generally reads as |
|---|---|
| Under 1% | Low — worth investigating |
| 1–3% | Average for most accounts |
| 3–6% | Good |
| Above 6% | Strong |
Two qualifications. Rates fall as accounts grow — almost universally. A thousand-follower account at 8% and a million-follower account at 1.5% may both be performing well, because large audiences inevitably include people who followed once and never returned. Compare against accounts of a similar size.
And platforms differ. TikTok typically produces higher rates than Instagram, which typically beats Facebook and X, because the feed algorithms surface content to different proportions of the audience.
Why brands ask for it
Followers can be bought; engagement is harder to fake convincingly. A brand paying for a post is buying attention, and engagement rate is the cheapest available proxy for it. This is why a 20,000-follower account with 8% engagement frequently commands better rates than a 200,000-follower account at 0.5% — and why the TikTok Money Calculator treats deal rate as a negotiation rather than a formula.
A falling rate on a growing account is the pattern worth watching. It usually means recent growth brought in people who are not the audience you built for.
Privacy
The calculation runs in your browser. No account is connected, nothing is submitted and no figures are stored.
Frequently Asked Questions
What is a good engagement rate?
Roughly: under 1% is low, 1–3% average, 3–6% good, above 6% strong. But compare against accounts of a similar size — rates fall almost universally as follower counts grow, so a large account at 1.5% may be performing as well as a small one at 8%.
Should I divide by followers, reach or impressions?
Any of the three is defensible, but they produce different numbers from identical activity — reach and impressions give lower rates than followers. This tool uses followers, the most common choice. The important thing is to use the same one every time and say which.
Do saves and shares count?
They can, and the optional extra field is there for them. Include them consistently. A rate that counts saves one month and not the next cannot be compared with itself, let alone with anyone else’s.
Why does my rate fall as I gain followers?
Because large audiences accumulate people who followed once and never came back, and platforms show posts to a limited share of followers. It is the normal pattern, not a failure — but a sharp drop alongside fast growth suggests the new followers are not your real audience.
Which platform has the highest engagement rates?
TikTok generally produces the highest, then Instagram, then Facebook and X. The differences come from how each algorithm distributes content, so rates are only meaningfully comparable within a single platform.
Should I use one post or an average?
An average across your last 9 to 12 posts. A single post can be distorted by one unusually strong or weak result, and brands generally want to see a consistent figure rather than your best day.
Can engagement rate be faked?
Engagement pods and bought interactions do exist, which is why brands increasingly look at comment quality and audience location as well as the headline rate. Genuine engagement is harder to fake convincingly than follower count.
Is my data stored anywhere?
No. Nothing is connected to any account and no figures are submitted or saved. The calculation runs in your browser from the numbers you enter.